ブックタイトル竹中技術研究報告書No70
- ページ
- 40/86
このページは 竹中技術研究報告書No70 の電子ブックに掲載されている40ページの概要です。
秒後に電子ブックの対象ページへ移動します。
「ブックを開く」ボタンをクリックすると今すぐブックを開きます。
このページは 竹中技術研究報告書No70 の電子ブックに掲載されている40ページの概要です。
秒後に電子ブックの対象ページへ移動します。
「ブックを開く」ボタンをクリックすると今すぐブックを開きます。
竹中技術研究報告書No70
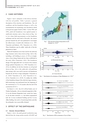
TAKENAKA TECHNICAL RESEARCH REPORT No.70 2014竹中技術研究報告No.70 20142 CASE HISTORIESFigure 1 shows schematics of the eleven structureswith the soil profiles. Table 1 presents a generaldescription of the structures and foundations. The soilconditions and the foundation design as well as theinstrumentation for monitoring were described in detailin the previous papers listed in Table 1. In the 1980s and1990s, piled raft foundations were applied mainly tosmall-scale structures such as those shown in Figs. 1(a)to 1(c) where field measurements on the foundationsettlement and the axial loads of the piles, the contactpressure beneath the raft were performed to investigatethe effectiveness of piled rafts (Kakurai et al., 1987;Yamashita and Kakurai, 1991; Yamashita et al., 1994).These foundations may be called‘piled rafts of the firstgeneration in Japan’.Piled raft foundations have been used for the relativelylarge structures such as those shown in Figs. 1(d) to 1(k),including a tall building in excess of 150 m in height,since a basic design framework has been established inthe early 2000s (Yamashita, 2012). The foundationdesign of the eight piled rafts was based on the commondesign method (Yamashita et al., 1998; Yamashita et al.,2011a). In addition, for the four structures on soft groundshown in Figs. 1(h) to 1(k), piled rafts with grid-formdeep mixing walls were used to prevent soil liquefactionbeneath the raft due to large earthquakes (Yamashita etal., 2011b; Yamashita et al., 2012; Yamashita et al.,2013a; Yamashita et al., 2013b). To confirm the validityof the foundation design of the relatively large structures,field monitoring were performed from the beginning ofthe construction to 17 to 102 months after the end of theconstruction (E.O.C.).On March 11, 2011, the 2011 off the Pacific coast ofTohoku Earthquake, with an estimated magnitude of M w =9.0 on the Moment Magnitude Scale, struck East Japan.As for the three structures, i.e., the hadron experimentalhall, the 12-story residential building and the 12-storyoffice building, the results of monitoring before and afterthe earthquake were successfully obtained.Fig. 2 PGA map derived from strong motion records(Kunugi et al., 2012) 16)Fig. 3 Time histories of accelerations at Tokai (Hashimura et al., 2011) 17)3 EFFECT OF THE EARTHQUAKE3.1 Seismic Ground MotionFigure 2 shows the peak ground acceleration mapderived from the strong motion records of K-NET andFig. 4 Time histories of EW accelerations at Toyo in Tokyo32