ブックタイトル竹中技術研究報告書No70
- ページ
- 44/86
このページは 竹中技術研究報告書No70 の電子ブックに掲載されている44ページの概要です。
秒後に電子ブックの対象ページへ移動します。
「ブックを開く」ボタンをクリックすると今すぐブックを開きます。
このページは 竹中技術研究報告書No70 の電子ブックに掲載されている44ページの概要です。
秒後に電子ブックの対象ページへ移動します。
「ブックを開く」ボタンをクリックすると今すぐブックを開きます。
竹中技術研究報告書No70
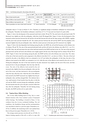
TAKENAKA TECHNICAL RESEARCH REPORT No.70 2014竹中技術研究報告No.70 2014Table 2 Load sharing among piles, deep mixing walls and soilSep. 16, 2008*1 Mar. 10, 2011*2 Mar. 11, 2011*3 Mar. 15, 2011 Apr.10,2012 to Jun.30,2014Ratio of load carried by piles 0.646 (0.540) 0.669 (0.589) 0.660 (0.580)0.667 (0.582) 0.663-0.672 (0.574-0.588)Ratio of effective load carried by D.M.W. 0.283 0.264 0.266 0.266 0.268-0.278Ratio of effective load carried by soil 0.071 0.067 0.074 0.067 0.053-0.065Values in parentheses are ratios of pile load to total load*1 End of construction*2 Pre-earthquake*3 Near end of the earthquake(600s after start of event)earthquake value to 17.6 mm on March 15, 2011. Therefore, no significant change in foundation settlement was observed afterthe earthquake. Thereafter, the foundation settlements varied from 16.7 to 17.8 mm and were found to be quite stable.Figure 13 shows the development of the measured axial loads of piles 5B and 7B. The axial load at the pile head of pile 7Bdecreased very slightly just after the earthquake, while that of pile 5B changed little. Figure 14 shows the development of themeasured contact pressure between the raft and the soil and that between the raft and the deep mixing walls (DMW), togetherwith the pore-water pressure beneath the raft. The contact pressure between the raft and the DMW near the periphery (D2)increased slightly from the pre-earthquake value, while the contact pressure in the inner part (D1) increased very slightly.Figure 15 shows the time-dependent load sharing among the piles, the DMW, the soil and the buoyancy in the tributary areaof columns 5B and 7B. The sum of the measured pile-head loads and the raft load in the tributary area after E.O.C. was 35.4-39.8 MN. Here, the raft load means the sum of the total load carried by the DMW and that by the soil. The sum of the measuredpile-head loads and the raft load in the tributary area roughly agreed with the sum of the design load for columns 5B and 7B of36MN. Figure 16 shows the load sharing among the piles, the DMW and the soil in the tributary area versus time. The valuesof the ratio of the load carried by each component to the effective load after E.O.C. are shown in Table 2. The ratio of the loadcarried by the piles to the effective load was estimated to be 0.67 just before the earthquake. At that time, the ratio of theeffective load carried by the DMW was estimated to be 0.26, while the ratio of the effective load carried by the soil was 0.07.During the earthquake, the ratio of the load carried by the piles decreased very slightly near the end of the event, and thenincreased close to the pre-earthquake value four days after theevent. The ratio of the effective load carried by the soilincreased only slightly from the pre-earthquake value near theend of the event, and then decreased to the pre-earthquakevalue four days after the event, while the ratio of the effectiveload carried by the DMW increased very slightly from the preearthquakevalue, and then changed little. This indicates that avery small amount of load transfer from the piles to both thesoil and the DMW occurred during the earthquake, and thenthe load transfer from the soil to the piles occurred within fourdays after the earthquake. Thereafter, the load sharing amongthe piles, the DMW and the soil was quite stable.3.4 Twelve-Story Office BuildingThe 12-story office building shown in Fig. 1(k) is a steelframedstructure with a base isolation system of laminatedrubber bearings. The building is located in Tokyo, 0.3 kmsoutheast from the 12-story residential building. The soilconditions, the foundation design and the instrumentationwere described in detail in a previous paper (Yamashita et al.,2013a). In addition, the monitoring results were updated fromthose in the previous paper (Yamashita et al., 2013b).The average contact pressure over the raft was 187 kPa. Toimprove bearing capacity of the raft, as well as to cope withFig. 17Foundation plan with locations of monitoring devices36