ブックタイトル竹中技術研究報告書No70
- ページ
- 45/86
このページは 竹中技術研究報告書No70 の電子ブックに掲載されている45ページの概要です。
秒後に電子ブックの対象ページへ移動します。
「ブックを開く」ボタンをクリックすると今すぐブックを開きます。
このページは 竹中技術研究報告書No70 の電子ブックに掲載されている45ページの概要です。
秒後に電子ブックの対象ページへ移動します。
「ブックを開く」ボタンをクリックすると今すぐブックを開きます。
竹中技術研究報告書No70
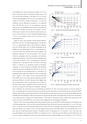
TAKENAKA TECHNICAL RESEARCH REPORT No.70 2014竹中技術研究報告No.70 2014the liquefiable loose clayey sand between depths of 5 to 15 mbelow the ground surface, the grid-form deep mixing wallswere constructed extending to the depth of 20 m with thebottom being embedded in the silty clay with undrained shearstrength of 100 kPa or higher. Furthermore, to reduce thesettlement and the differential settlement to an acceptablelevel, 180 PHC piles of 0.6 to 1.2 m in diameter were used.The pile toes were embedded in the very dense sand below thedepth of 44 m enough to ensure the toe resistance as well asFig. 18Measured vertical ground displacements below raftthe frictional resistance. The construction method of piles wassame as that used for the 12-story residential building. Figure17 shows the foundation plan with the locations of themonitoring devices.Figure 18 shows the measured vertical ground displacementsbelow the raft. The ground displacement at the depth of8.5 m was approximately equal to the foundation settlement.The 2011 off the Pacific coast of Tohoku Earthquake hit thebuilding site nine months before E.O.C. at which about 80 %of the total load of the structure acted on the foundation. Thefoundation settlement was 15.0 mm on March 1, 2011, ten daysbefore the earthquake. After the earthquake, the foundationsettlement increased by 0.8 mm from the pre-earthquake valueFig. 19Measured axial loads of pilesto 15.8 mm on March 16, 2011. Considering the increase insettlement due to the increase in the construction load duringMarch 1 to March 11, no significant change in foundationsettlement was observed after the earthquake. The foundationsettlement increased considerably just before E.O.C. due to thewater pouring into the underground pits. Thereafter, thesettlement became stable and reached 21.2 mm 32 months afterE.O.C. (August 1, 2014). Figure 19 shows the measured axialloads of Piles P1-P4 versus time. After the earthquake, the pileheadloads of Piles P1, P2 and P3 decreased very slightly fromthe pre-earthquake, while the pile-head loads of Piles P4increased a little. Here, it should be noted that there was theincrease in construction load before the earthquake mentionedFig. 20Measured contact pressure with pore-water pressureabove. Thereafter, the axial loads increased considerably just before E.O.C. due to the water pouring in to the pits. Figure 2 0shows the development of the measured contact pressure between the raft and the soil and that between the raft and the DMW,together with the pore-water pressure beneath the raft. Meanwhile, the contact pressure between the raft and the DMW increasedmarkedly after the earthquake, while the contact pressure between the raft and the soil changed little. One reason for the increasein the contact pressure is supposed to be improvement of“weak contact”between the contact surface of the earth pressure celland the top surface of the DMW due to the vertical cyclic loading from the raft during the earthquake.Figure 21 shows the time-dependent load sharing among the piles, the soil, the DMW and the buoyancy in the tributary areaof the instrumented piles. The sum of the measured pile-head loads and the raft load area varied from 61.3 to 64.1 MN afterE.O.C., so that the sum of the measured pile-head loads and the raft load was generally consistent with the design load of 64.0MN in the tributary area. Figure 22 shows the load sharing among the piles, the DMW and the soil in the tributary area versustime. The ratio of the load carried by the piles to the effective load was estimated to be 0.72 on March 1, 2011. At that time, theratio of the effective load carried by the DMW was estimated to be 0.07, while the ratio of the effective load carried by the soilwas 0.21. After the earthquake, the ratio of the load carried by the piles decreased slightly to 0.67 on March 16, 2011. The ratio37